What is IPT?
Industrial Process Tomography (IPT) is a set of instrumentation technologies that aim to provide unparalleled internal information of industrial processes used in many business sectors. In essence it gives data similar to that of the clinical ‘body scanner’ which has revolutionised modern medicine. It operates in a similar way through multipoint measurement and processing to give ‘real-time’ information of flows and distributions. This in turn facilitates improvements in product quality and process productivity; and reduction in waste, emissions and energy costs. A fuller ‘How does IPT work?’ description with illustrated examples is provided below.
Where can it be applied?
Application sectors include: biotechnology; bulk and speciality chemicals; environmental processes such as material transport; fast moving consumer goods such as personal products; mining separation processes; nuclear processing monitoring; oil and gas in oilfield flows; pharmaceutical product monitoring and control; metal production; pulp and paper processing; and the list of fields is constantly increasing. For example, in conveying it provides spatial distribution and flow rates of components; in processing vessels it provides 3D data on the progress of a physical or chemical reaction; it gives detailed insight into structural transformations in colloids and gels; and in mineral engineering it facilitates direct monitoring of separation and transport operations to maximise production.
Where can I find more information?
To read more technical details read below. To discover further information on research, contacts and IPT events simply Register on this website to immediately join the ISIPT Community. It is free and your details will be used only to inform you about IPT matters and events. Registered members have Open Access to all previous World Congress Proceedings, and can take copies of individual papers for personal use. These are classified into key topics and areas. Whether you are a researcher or an industrialist with a potential application we think you will find the topics of direct interest. We hope that you will attend an ISIPT event to meet others and discuss your interests and needs. ISIPT welcomes all of those interested in the technology and its applications from academic researchers to industrial users.
How does IPT work?
 The term ‘tomography’ is familiar to us all from medical ‘Computer-Assisted Tomography’ (CAT). Here the subject lies within a ring fitted with a peripheral X-ray source unit and an opposing detector. A narrow beam is passed through the subject and the detector measures the residual energy, after attenuation, providing a single ‘projection’ value. As the subject is practically stationary the source/detector ring can be rotated in steps to produce thousands of projections over a period of time. The dataset is processed to solve the ‘inverse problem’: to estimate one cross-sectional attenuation (density) image. This processing operation is conventionally called ‘reconstruction’ (of the object present to produce the projection set). The subject is moved axially and further images are obtained to form a 3D CAT-Scan, as illustrated, for interpretation by an expert clinician.
IPT exploits the tomographic principle illustrated above, but with major differences. Human bodies are mostly homogeneous, having soft tissues and bones. In contrast industrial processes are typically highly inhomogeneous. Apart from cardiac motion they are also static, but in contrast most industrial processes have major dynamic features, for example in industrial mixing and conveying. Whereas clinical information is intended mainly for human interpretation; in the process case in-line and on-line measurement and control typically requires automated interpretation.
 In generic terms IPT provides internal distribution data through the basic principle of injecting excitation energy into a process for a specific spatial ‘projection’, and sensing the resulting observable response at one (as in the X-ray case) or many appropriate positions. Although X-rays are used, other energy ‘modes’, for example the injection of electrical energy, typically require a number of measurements per projection.
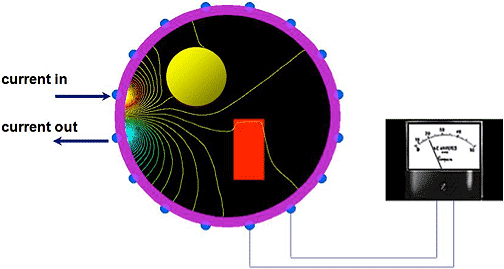
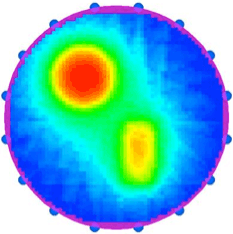
  Here the injection of a constant current between two points on the periphery of a process creates a distributed conduction field, whose observable peripheral distribution must be observed by sensing the voltage between several points around the periphery. Hence in this case several measurements are typically required for each projection. In the illustration a field is formed around two objects in a conducting medium: one object of higher conductivity and one of lower conductivity. The resulting reconstructed image shows the estimated internal distribution based on electrical conductivity.